

[tabs slidertype= »left tabs »] [tabcontainer]
[tabtext]Landscape Sketch[/tabtext]
[tabtext]DC Map[/tabtext]
[tabtext]Stats[/tabtext]
[tabtext]Infographic[/tabtext]
[tabtext]Thematic Maps[/tabtext] [/tabcontainer]
[tabcontent] [tab]
Make a Landscape Sketch choosing one of the pictures bellow. Here are the different steps:
- Make a description of the picture using the “How to describe” sheet
- Make a landscape sketch using the picture taken in your neighborhood
- Make a Key
- Find a Title
Brookland:

Capitol Hill:

Congress Heights: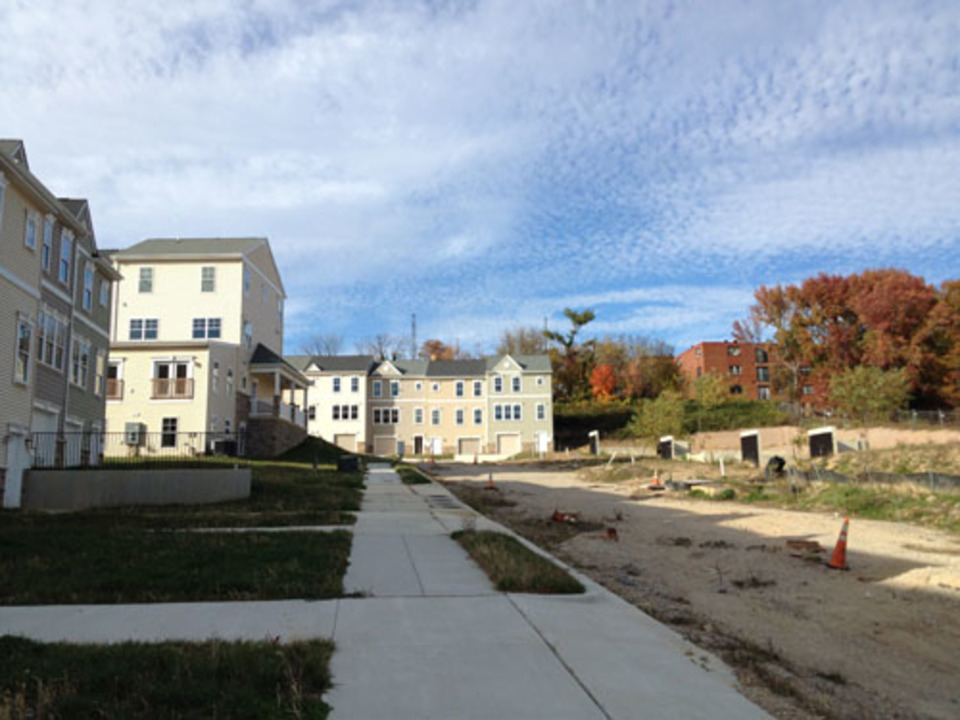
Georgetown: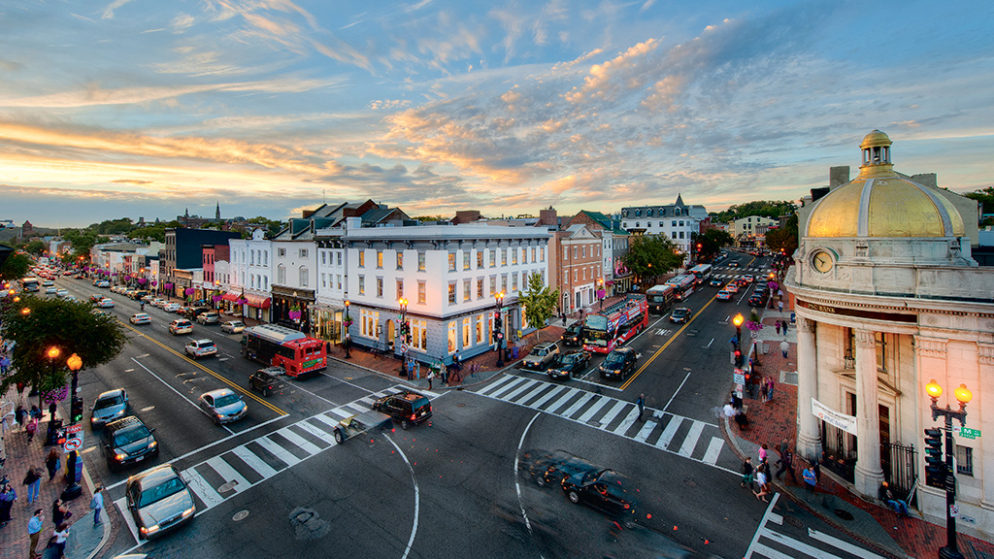
Southwest:
Anacostia: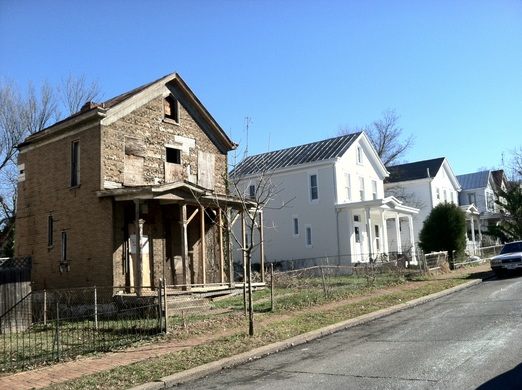
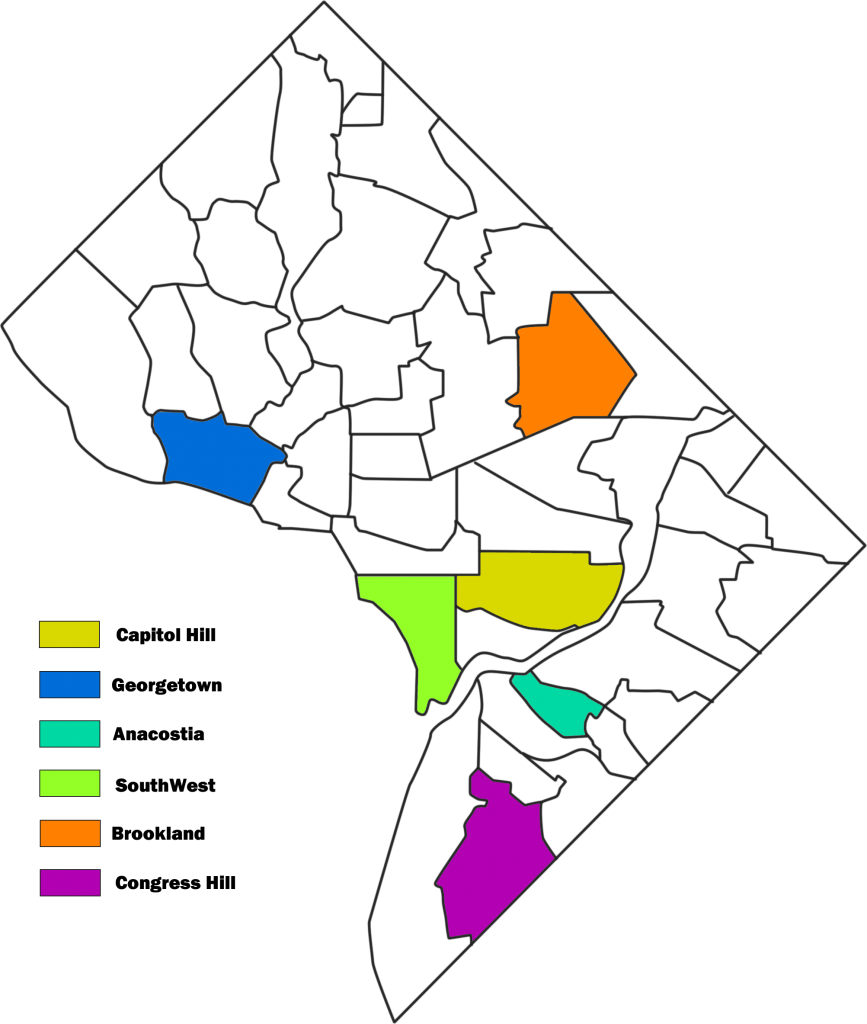
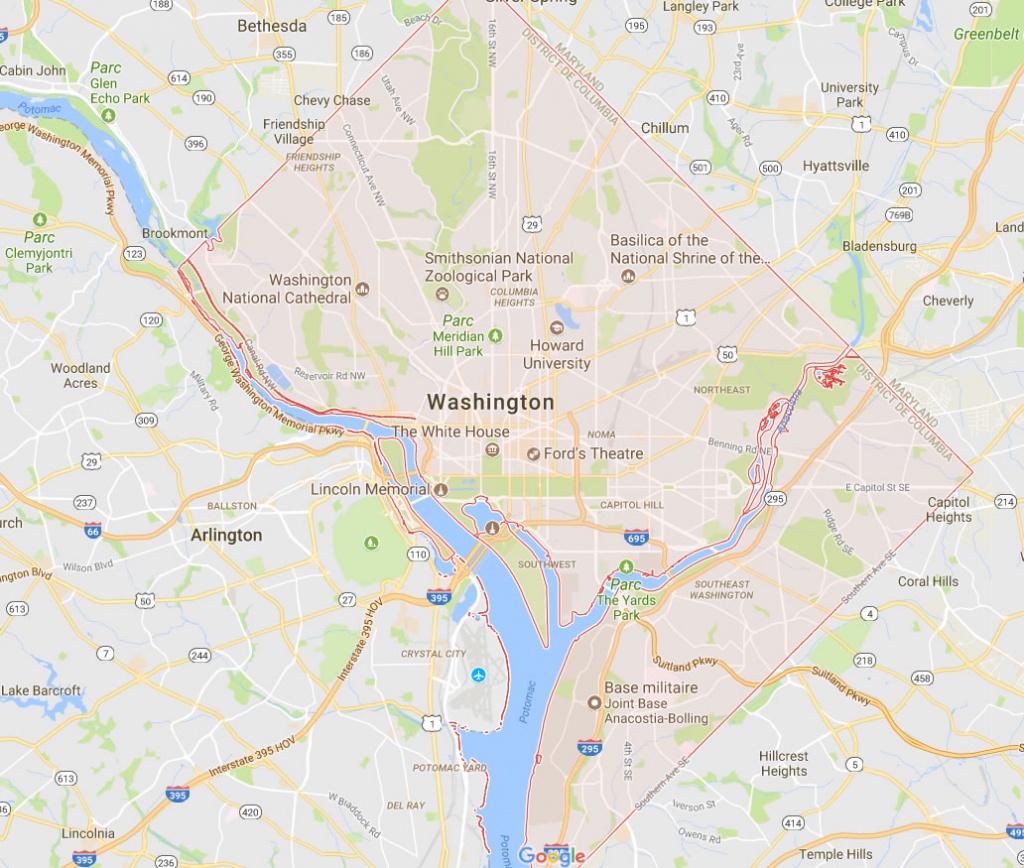
[/tab][tab]
Make your own map of D.C. using the thematic maps
You must put the following information in the key:
- River
- Airports
- Interstates
- Density of population (number of inhabitants per square miles).
Less than 10000hab/sq miles
More than 10000hab/sq miles
[/tab][tab]
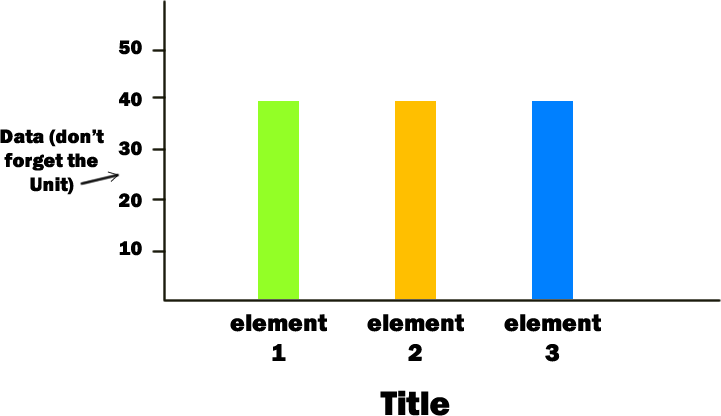
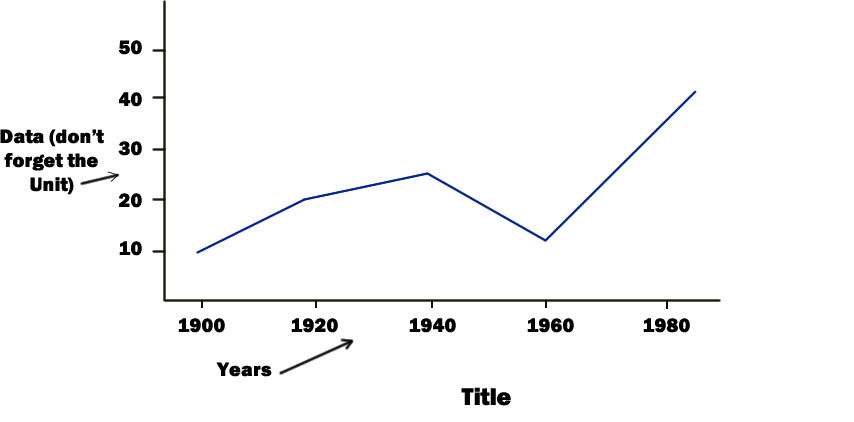
Use the data to make your own charts.
There are 3 types of Charts: pie charts, lines charts and bar charts. Do at least 2 type of charts.
You must do 3 charts:
- Evolution of Population
- Ethnicity
- Population of DC and other Cities.

[/tab]
[tab]
Life in DC
Find 3 pros and 3 cons of living in Washington DC
Make your own infographic to answer
Infographic: An infographic (information graphic) is a representation of information in a graphic format designed to make the data easily understandable at a glance. People use infographics to quickly communicate a message, to simplify the presentation.
[/tab]
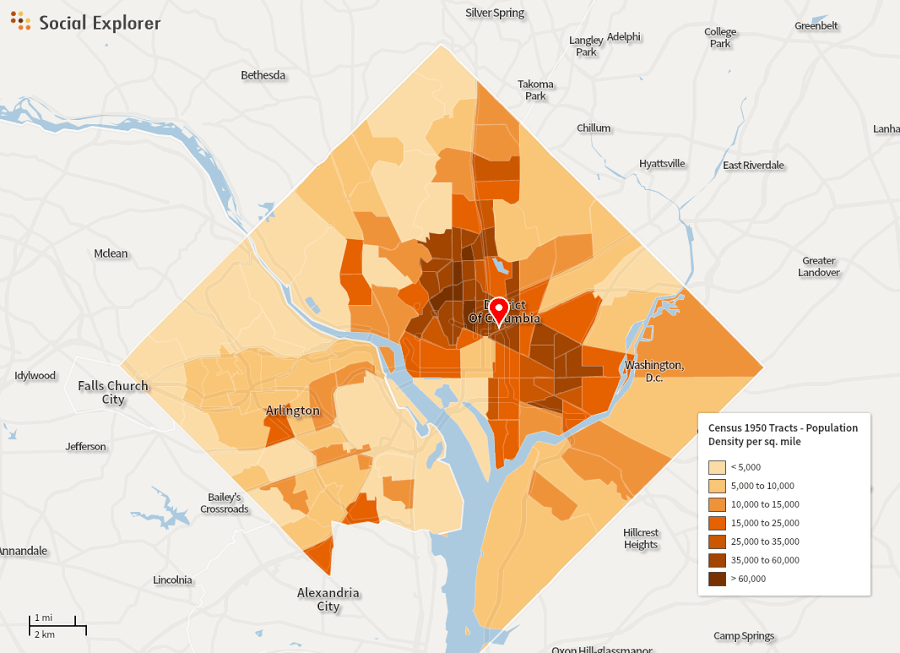
[tab]
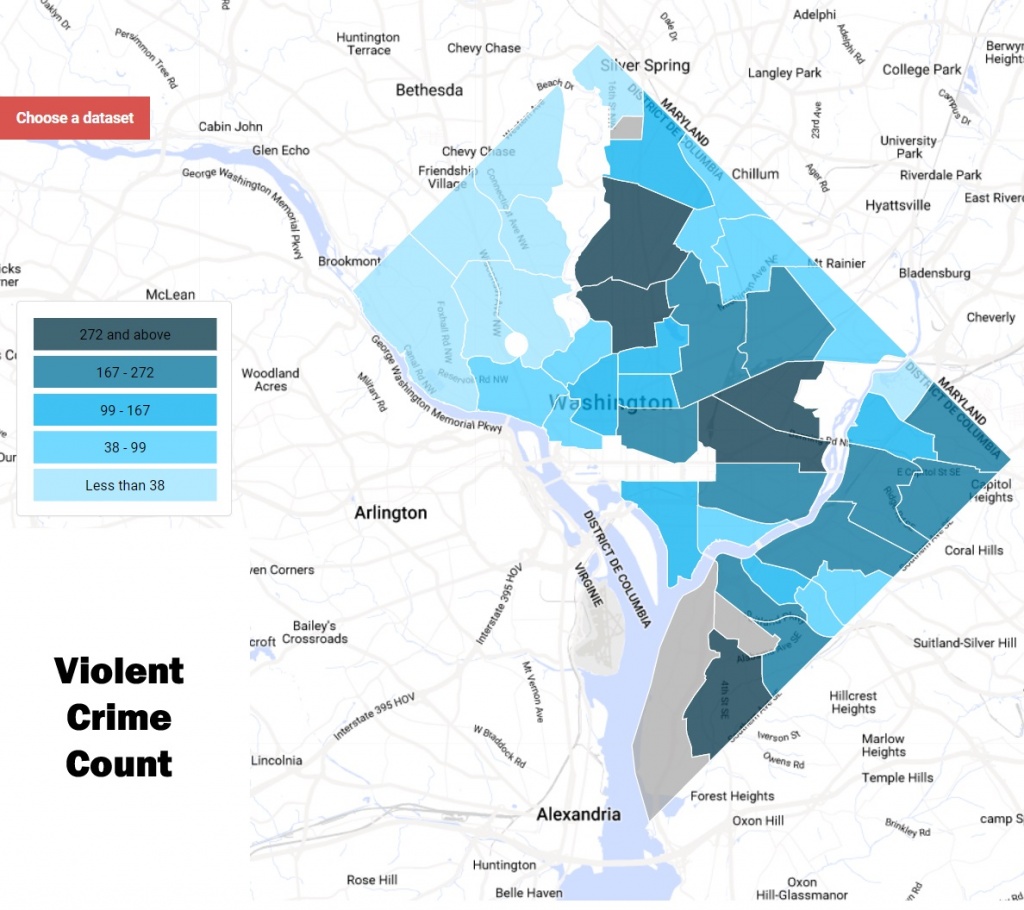
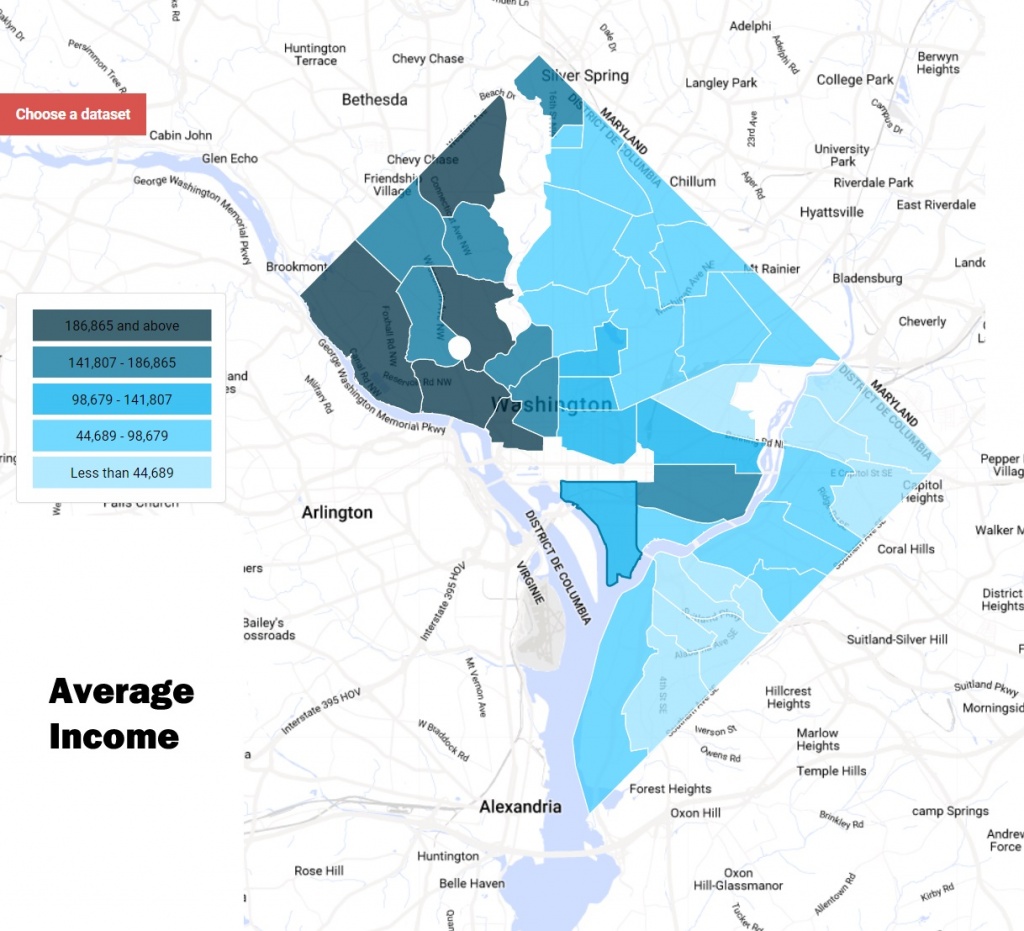
Use the thematic map to do your own thematic map
Tip: you have to group different range of the key of the thematic maps to do your own key/map
[/tab]
[/tabcontent] [/tabs]
Glossary:
Inhabitants: habitants
Neighborhood: quartier
Data: statistique
Key: légende
Chart: graphique